|
Today, students continued to practice the standards they have learned in Unit 6. Tomorrow, we will take the Unit 6 Test!
0 Comments
Today, students engaged in a gallery walk activity to review the Unit 6 standards. Everyone will test on this unit Friday! You should understand the following:
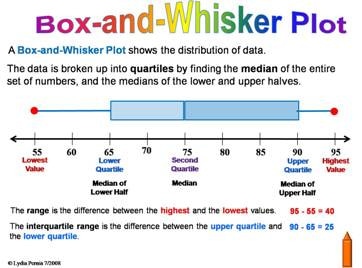
Today, students continued learning how to display and analyze data in a box plot (a.k.a. box and whisker plot). Students practiced the skill in their MSG, and they also learned about IQR (interquartile range). We will all test on Unit 6 this Friday!
Today, students learned to display and analyze data in box plots (a.k.a. box and whisker plots)! Students interacted with a SmartBoard activity to create box plots, and they practiced the skill in their MSGs.
 Today, students took a quiz on interpreting and analyzing dot plots, frequency tables, and histograms. Next Friday, we will take the Unit 6 Post-Test on statistics! Helpful Websites: Bamzooki! Game The Legend of Dick & Dom Frequency Tables Game
 Congrats to these students for making an A on today's quiz! :)
Bothers: Maryjane, Aniekan, Brandi, Stefani, Juliana, Emily C, Asa, Lalla Kenza, Kayla, Shaniece, Hala, Janea, Oumar, Andrew, Jada, Ahmed, Arsh, Jessica, Natalia Leach: TBA Ledesma: TBA Schwak: TBA Students continued to display, interpret, and analyze data in frequency tables and histograms! They worked through problems in the MSG, as well as a group activity. All students will take a quiz tomorrow on dot plots, frequency tables, and histograms! Homework:
Bothers: MSG p. 219; IXL due Monday Leach: Message Math Histogram sheet Ledesma: MSG p. 219; IXL due Monday Schwak: Study for quiz Today, students learned to display, interpret, and analyze data in frequency tables and histograms! Mrs. Schwak's classes and Mrs. Bothers' classes worked on these skills on IXL in the computer lab. See yesterday's post for video tutorials/resources. Homework:
Bothers: IXL GG3, GG4, GG6, GG11, GG12 due Monday Leach: Strip of problems (MMMR analysis); Quiz Corrections due by Friday Ledesma: Complete Frequency table/histogram Activity WS; IXL SP2 & SP5 Schwak: Practice IXL Standards from today
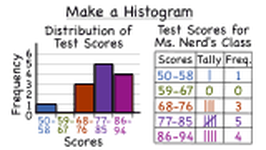
Check out the example below of a frequency table with intervals and a histogram! 
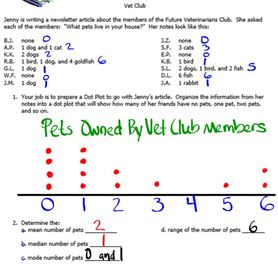
Today, students learned to display, interpret, and analyze data in dot plots! Students took guided notes and practiced analyzing data.
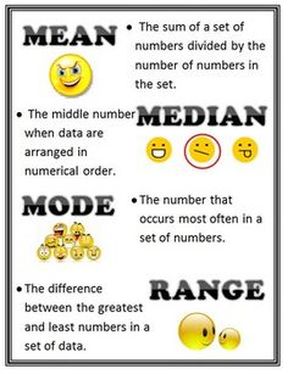
Today, students took a quiz on statistical questions and mean, median, mode, and range. Overall, students performed extremely well on this quiz, so keep it up! We will continue to analyze data using mean, median, mode, and range as we progress throughout the unit.
|
AuthorsAudra Bothers (6A) Katz Quick Checks Page
Click Here Teacher Shout Outs
Click Here Archives
March 2020
CategoriesContact Forms |


 RSS Feed
